fbpx
Skip navigation
Low Traffic Neighbourhood (LTN) with happy people cycling

Healthy Streets Scorecard 2023 launches

City, Islington and Hackney top Healthy Streets Scorecard 2023. Hillingdon, Bexley and Havering named as lowest scoring councils.

Share

Share this page

Best and worst boroughs…

This blog is primarily taken from Healthy Streets Scorecard media release.

Top performing London Boroughs

In the Healthy Streets Scorecard for 2023 are City, Islington, Hackney and Camden, with Southwark moving past Westminster to gain a Top 5 slot. Well known for its LTNs and cycle routes, award winning Waltham Forest leads the way in Outer London, scoring higher than some Inner London Boroughs.

Lurking at the bottom of the table

Worst in 2023 are Hillingdon, Bexley and Havering with car-dominated environments failing to enable residents to switch to public transport, walking and cycling. The worst performing Inner London boroughs are Kensington & Chelsea and Lewisham.

“Some London boroughs, despite declaring a climate emergency, continue to send a message to residents that the car is king, and the only mode switch needed is perhaps from a diesel SUV to an electric one years away. But the evidence and the science says starkly otherwise.” comments Simon Munk, Head of Campaigns.

“We need every borough – particularly those lagging behind such as Kensington & Chelsea, Bromley and Hillingdon – to get moving on switching away from cars whenever possible, on actively enabling active and sustainable travel modes. No more excuses – the clock is ticking.” 

5 top boroughs given awards

This year, the coalition has given awards to five boroughs:

  • Healthy Streets Scorecard overall winner: City of London – the London area with the highest overall Healthy Streets score leads the way on delivering schemes for walking, wheeling & cycling, as well as public transport, and reducing and restricting car use. It may have an inherent advantage on scores given its small number of residents, but its transport strategy is widely lauded as visionary and, importantly, the City’s actions often exceed their words – with schemes such as Bank Junction, Aldgate Square and the upcoming St Paul’s scheme.
  • Top Inner London borough: Islington – progress on delivery may have slowed slightly from the start of the pandemic but Islington is the top-scoring Scorecard inner London borough for good reason, with high levels of delivery on 20mph speed limits, bus priority, LTNs, school provision and controlled parking.
  • Top Outer London borough: Waltham Forest – the north-east London borough is becoming famous, and has won several major awards for delivering Healthy Streets schemes. It was one of three outer London boroughs awarded £30 million from the Mayor’s “mini-Holland” programme in 2013. Its schemes from that period are class-leading and continue to set a quality bar the rest of London struggles to match. And it has since gone on year after year to deliver more.

Some boroughs have scored higher (or lower) than we would expect given their housing density.
The more densely populated boroughs have an advantage in the Scorecard, so we now also publish data showing the actual scores boroughs achieve compared to the score they are predicted to achieve based on their housing density.

  • Inner London Borough outscoring on housing density: Camden – Camden is a high-performing inner London borough on the Scorecard year after year, but it notably delivers beyond its expected score when adjusted for density compared to other inner London boroughs.
  • Outer London borough outscoring on housing density: Richmond – Richmond is a relatively affluent and low-density outer London borough but far outperforms similar boroughs on delivery of Healthy Streets measures. Its delivery of 20mph speed limits on borough-controlled roads is particularly impressive.

New mapping for Scorecard 2023

The Healthy Streets Scorecard coalition continues to upgrade and develop new measures to improve the accuracy of its data and develop and introduce new scores every year. As a result, the Scorecard is now arguably the most advanced tool for measuring council progress on measures to reduce car use and enable alternatives to help London cut emissions and be healthier.

This year, the coalition has mapped Controlled Parking Zones in a move to improve data on that metric; and developed a new scoring system based partially on ‘opportunity to park’ with entire borough, or large zones, allowing residents to park anywhere, scored lower than smaller zones based on a few streets.

The coalition also mapped the entire bus network to establish which boroughs have the most bus lanes or other ‘bus priority’ measures, providing faster journeys, and integrated this into the final borough scores this year.

Scores were once again adjusted for density to account for natural ‘bias’ where higher density areas score higher. This shows some councils you’d expect to score poorly score well, while some you’d expect to score very well (Kensington & Chelsea) score worse than expected.

Best and worst by indicator

  • % of streets inside a Low Traffic Neighbourhood – ranges from 69% (Hackney*) to 5% (Bexley)
  • % of schools with traffic-free School Streets – ranges from 51% (Islington) to 0% (Bexley, Hammersmith & Fulham)
  • School STARS (% of maximum possible points in promoting sustainable travel to schools)- ranges from 62% (Bromley) to 11% (Hackney*)
  • Controlled Parking Zone coverage ranges from – 98% (Hackney) to 10% (Bromley)
  • 20mph speed limits as % of borough managed roads – ranges from 100% (Camden, City of London, Hackney, Islington, Kensington & Chelsea, Lambeth, Lewisham, Richmond, Southwark, Tower Hamlets, Wandsworth, Westminster) to 5% (Barnet)
  • Cars registered per 100 households – ranges from 32 (Islington*) to 109 (Hillingdon)
  • % of polluting diesel cars – ranges from 15% (Camden) to 27% (Hillingdon)
  • % of bus routes with bus priority (bus lanes, bus gate modal filters etc.) ranges from 51% (Hackney*) to 1% (Bexley)

* Excluding the City of London

Full results and year on year analysis is available at the Healthy Streets Scorecard site.

READ MORE NEWS

Londoners share love of cycling

Hundreds of stories from Londoners across the capital about why you love cycling

Read more Go to this post
Government report shows LTN popularity

The UK government has published its review of Low Traffic Neighbourhood's, announcing a "crackdown", despite its own report loving them…

Read more Go to this post
Women ride for freedom

Nearly a thousand women joined the LCC Women's Freedom Ride on Sunday 3 March

Read more Go to this post
Cycleway 4 open today

Cycleway 4 through Southwark, Lewisham and Greenwich means Mayor has 4x Cycleways since 2016.

Read more Go to this post

KEEP UP TO DATE

All the latest cycling news, campaigns and information straight to your inbox.
  • This field is for validation purposes and should be left unchanged.
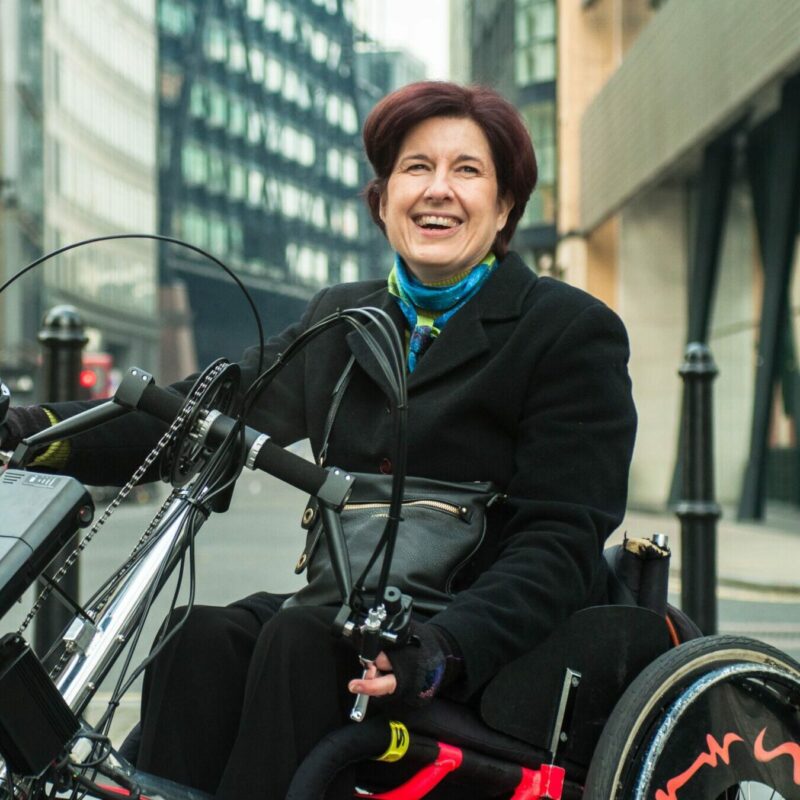
Isabelle Clement Wheels for Wellbeing disability cycling with adapted cycle